Next California: The Mississippi Delta and its People
- Date: 21 July 2020
- Author: Julia Kurnik, director of innovation startups, WWF Markets Institute
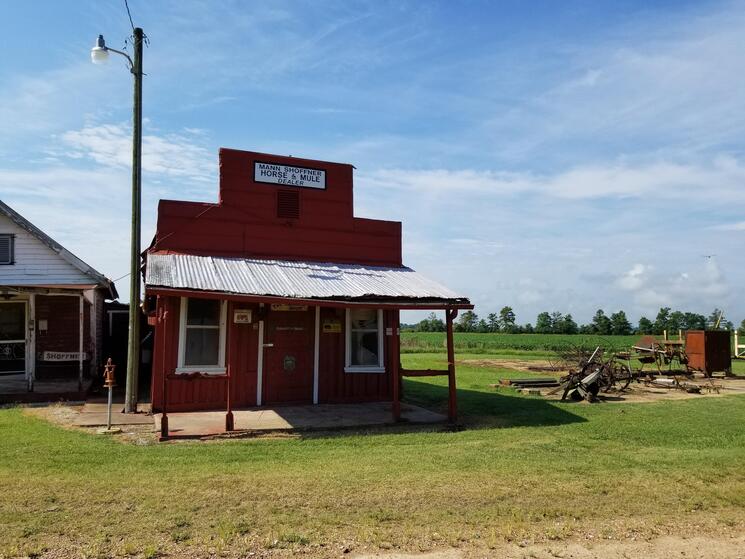
The mid-Delta region has a deep connection to agriculture. The Mississippi River and the smaller Arkansas River have good soil and are transportation corridors. Agriculture has driven the economy in the region since the first European settlers arrived. Sugar and rice dominated the 18th century, and cotton became king in the early 19th century. These row crops remain common, but now wheat, soy, and corn (soy and corn for animal feed) have also become mainstays. Today, 75% of farmland is used to produce row crops, with 25% used for specialty crops.
Agriculture also has an iniquitous history for the region. As cotton and sugar cane spread, more labor was needed, and slavery flourished as large plantations developed. After the Civil War, sharecroppers and tenants replaced slaves. With land still in plantations, freed slaves and poor whites had little chance of becoming landowners and even when they did, several government programs helped larger landowners acquire the lands of former slaves. During the Depression thousands of small farmers, tenants, and sharecroppers lost their jobs and/or farms. Federal relief was largely aimed at whites, leading to further racial disparities and continued flight by African Americans to cities. Even after the economy recovered, farming continued to change. It became mechanized and required much less labor. Fewer people worked more land. WWII ramped up agricultural demand, and Delta agriculture flourished once again, and it remains an economic mainstay today.
However, despite the demand for its crops, the region remains poor. The massive farms in the Delta region do well when prices are high, but few people own those, and smaller farms in the Arkansas River Valley barely support their owners. This region has high poverty rates (Delta 19.8%, River Valley 16.2% - as opposed to the national average of 12.3%) and low median incomes (Delta $45,479, River Valley $48,536 – nationally $57,652) according to 2018 Census data¹. Much of this poverty hinges on commodity crop production. Low margins mean small farms cannot make ends meet and growers must also work other jobs, if they are available. They are eager for new models but do not have the ability to make changes on their own.
Health and nutrition of the rural population are often poor in this region. Arkansas and Mississippi have some of the highest rates of obesity in the country, with more than 35% of adults qualifying as obese. Tennessee is just behind with 30-35%. At the same time, these three states have some of the lowest rates of farmers markets and even worse rates of fruit and vegetable consumption. Arkansas is the state with the lowest rate of eating fruit in the US and Mississippi has the second lowest rate of eating vegetables (after Louisiana).
Finally, the region faces significant racial hurdles. Built on a historical context of white landowners and slavery, racism is still real and threatening. Populations remain segregated—nearly all farmers in the region are white men—and in an already poor region, minorities suffer the most economically. These states are also at the top of the list for the number of hate groups in the area per capita².
Despite these hurdles, local food culture remains strong. Fried catfish, okra, corn bread, and collards remain staples that bring regional pride. Local fruits flourish, such as paw paws and muscadine grapes. There are a few larger cities, such as Memphis, but most of the region is made up of small towns with vast farms between them. Communities are close knit. The topography changes from flat plains along the Mississippi River to mountains alongside the Arkansas River Valley, bringing cooler temperatures and less humidity, but all provide strikingly beautiful tableaus, rich history, and endless possibilities for the future.
¹Original calculations for The Next California: Phase 1 report, using 2018 Census data
²Per capita information calculated using data from the Southern Poverty Law Center and 2018 Census Data
Previous post in this series:
• Introduction
Future posts in this series:
• Benefits to the Region
• How We Get There
• 50 Years from Today